Broadline Distributor Cost Intelligence SaaS for Independent Restaurants
412,498 independent restaurants buy from the same broadline distributors as 200-unit chains but pay 18–35% street markups while the chain across the parking lot negotiates cost-plus-five. The pricing gap is worth an estimated $31 billion a year, and no benchmarking tool exists to make it visible.
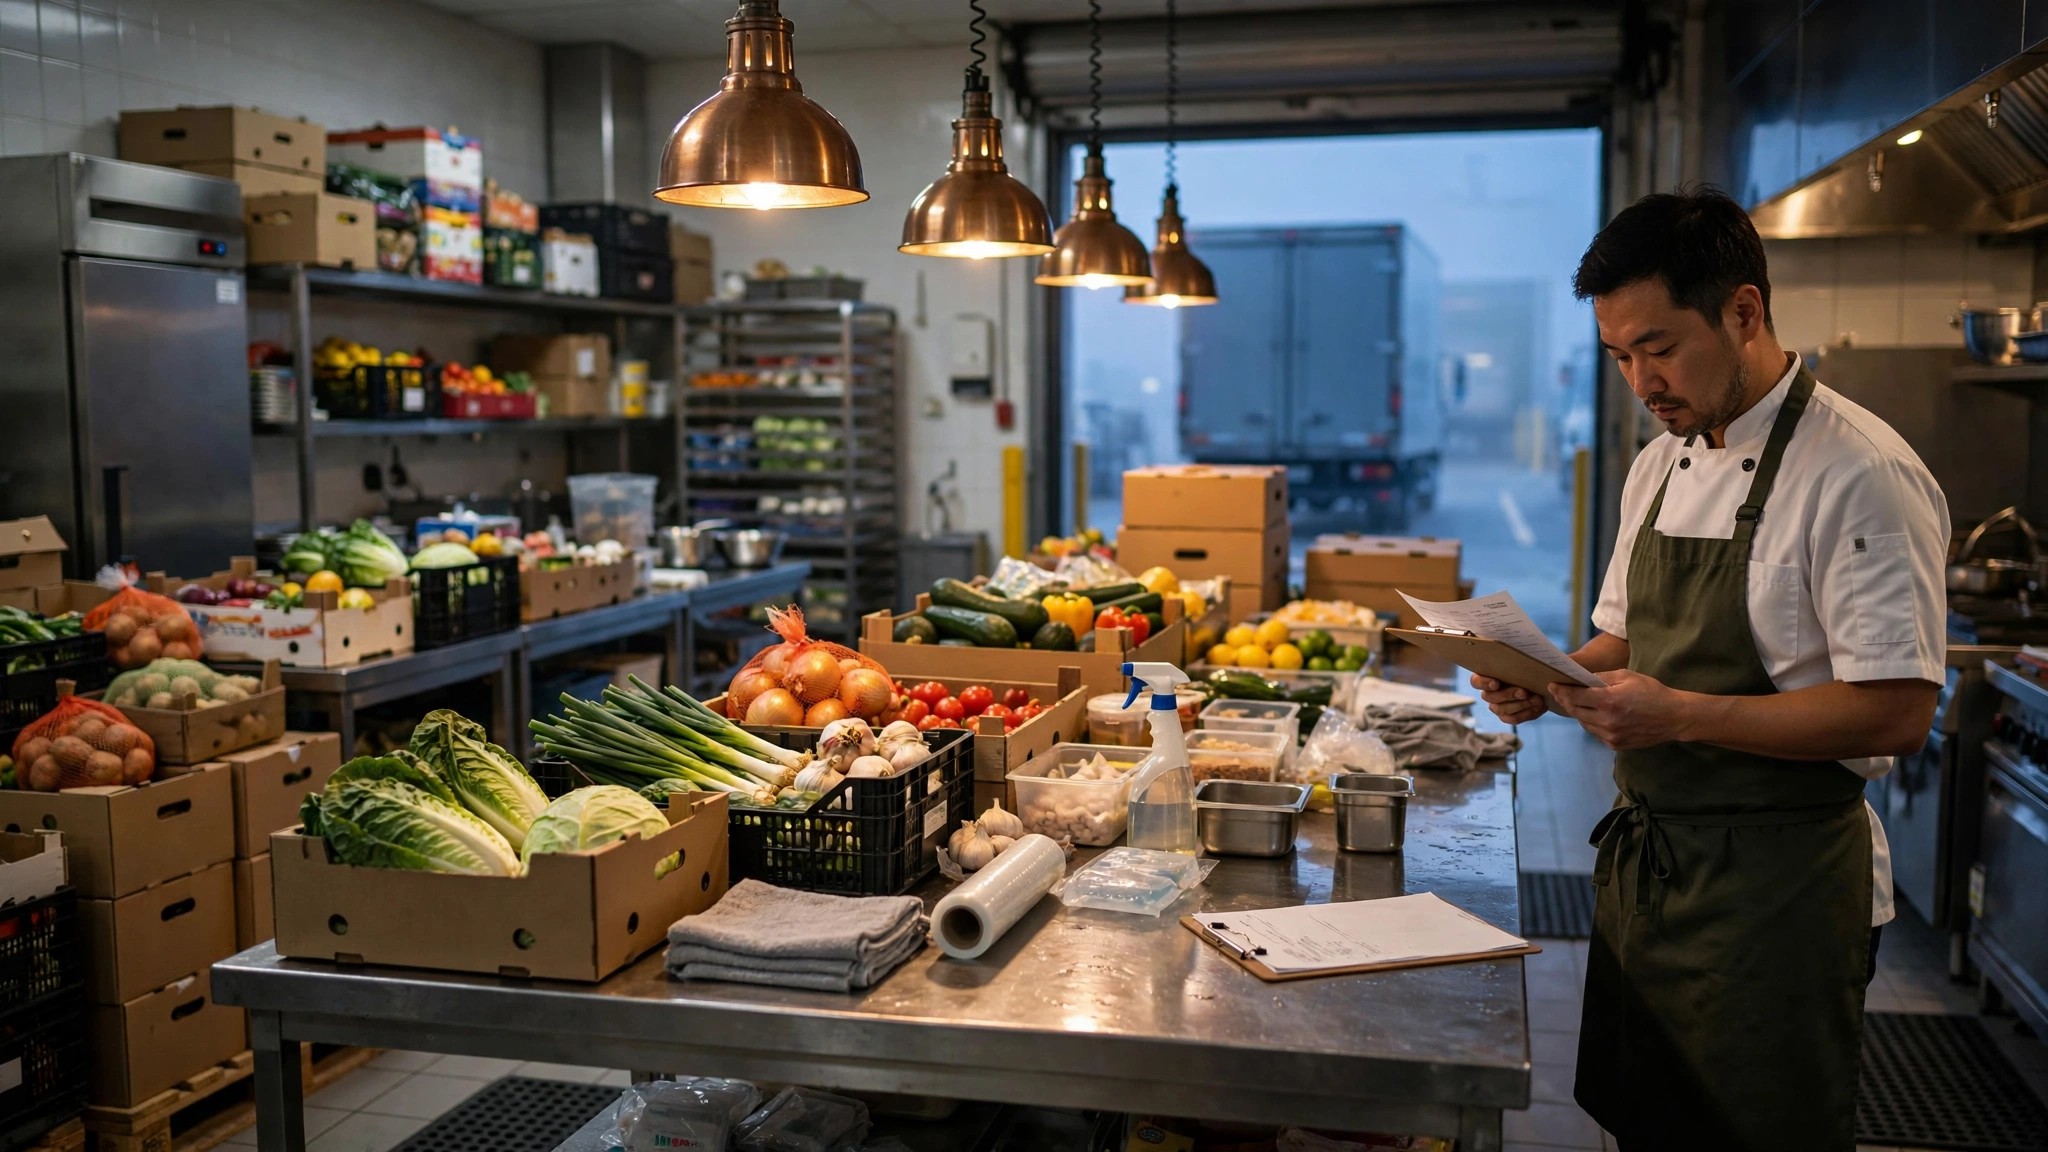
The Problem
The U.S. foodservice distribution market is a $377 billion domestic market dominated by three companies: Sysco ($85 billion LTM revenue, 18% market share), Performance Food Group ($60 billion), and US Foods ($37.9 billion). Together they control roughly 35% of the market, up from 28% less than a decade ago, and the share gains are accelerating. Sysco's $29.1 billion proposed acquisition of Jetro Restaurant Depot, announced March 2026, would fold the country's largest cash-and-carry foodservice wholesaler (166 warehouses, 725,000 mostly small restaurant customers) into the largest broadline distributor. US Foods and PFG are simultaneously exploring their own combination, which would create a $98 billion revenue entity. The independent restaurant is the person standing between two oncoming trains.
At the end of 2025, 412,498 independent restaurants remained in the United States, down 2.3% from the prior year, a net loss of more than 9,500 locations (Technomic). Full-service independents were hit hardest, contracting 2.6%. Meanwhile, the Top 500 chains grew unit count by 1.5%. "It's harder than ever, for the industry in general, but for independents in particular to operate," said David Henkes, senior principal at Technomic. Median pretax income at full-service restaurants has fallen to 2.8% of sales, down from 4% in 2019, according to the National Restaurant Association's 2025 Restaurant Operations Data Abstract. The bottom quartile of full-service restaurants reported a pretax loss of 2.1% of revenue. At those margins, a 2% food cost improvement is not an optimization. It is the difference between survival and closure.
The structural mechanism behind this squeeze is tiered distributor pricing, and it operates almost entirely in the dark. National and multi-unit chain accounts negotiate cost-plus pricing with broadline distributors: sometimes cost-plus-five, sometimes a flat per-case markup, sometimes deviated pricing negotiated directly with manufacturers like Tyson, Cargill, or Heinz. The distributor functions as a logistics platform for that lane, billing the chain at or near the manufacturer's negotiated price. The independent restaurant down the street, buying the same case of the same product off the same truck, pays what industry insiders call "street pricing" or "guidance markup," a tiered markup that typically runs 18–35% above cost depending on category, account volume, and how badly the district sales manager wants to hit his GP% target that period. Produce and protein carry the highest markups because they are price-volatile and operators cannot easily price-shop them line by line. Frozen and dry goods get tighter because operators occasionally compare invoices.
The result, as one industry analysis described it: "A sub-million-dollar independent restaurant in your market is typically running 30–34% food cost on a menu engineered for street pricing. The same restaurant, if it could buy at the pricing a 200-unit casual chain pays, would be at 26–28%. That four to six points of margin is, in most cases, the difference between viable and not." The independent operator has never seen the chain's invoice. They think they are paying market price. They are paying street price. And the chain across the parking lot is using its four-point food cost advantage to underprice the menu, run more aggressive limited-time offers, and absorb the rent escalation that is pushing the independent out.
Market Size
| Funnel Stage | Count | Derivation |
|---|---|---|
| Independent restaurants (US, end of 2025) | 412,498 | Technomic / Restaurant Business |
| Less: sub-scale (<$300K annual revenue) | −82,500 | ~20% one-person operations (NRA) |
| Less: restaurant groups with internal procurement teams | −16,500 | ~4% with 5+ locations and dedicated buyers |
| Addressable independent restaurants | 313,500 | |
| Blended ARPU | $149/mo | 65% Standard $99, 35% Premium $249 |
| Base TAM | $560M ARR | 313,500 × $149 × 12 |
TAM detail: The 412,498 independent restaurant count comes from Technomic's preliminary 2025 data. The National Restaurant Association reports that 9 in 10 restaurants have fewer than 50 employees and 7 in 10 are single-unit operations. We exclude sub-scale operations under $300,000 in annual revenue (approximately 20% of the base, predominantly food trucks, seasonal pop-ups, and ultra-small takeout counters where food purchasing is done at warehouse clubs rather than through broadline distributors) and larger independent groups with five or more locations that typically have a dedicated purchasing manager or belong to an existing GPO. The remaining 313,500 restaurants represent the core addressable market: single to four-unit independents doing $300K–$5M in annual revenue, purchasing primarily through one or two broadline distributors, without visibility into what comparable restaurants in their metro are paying.
At a Standard tier of $99/month (anonymized price benchmarking on top 200 SKUs by metro, distributor markup alerts, quarterly market rate reports) and a Premium tier of $249/month (full item-level benchmarking, distributor negotiation briefs, vendor rebate identification, supplier alternative matching), the blended ARPU of $149/month is positioned below the cost of a single case of center-of-plate protein saved per week. The realistic SAM targets 35,000 paying restaurants by Year 4 at blended $149/month, plus $8 million in data licensing to GPOs, restaurant PE firms, and food manufacturers evaluating distribution channel economics, yielding a Year 4 target of $70.6 million ARR.
The Product
An anonymized distributor cost benchmarking and procurement intelligence platform, purpose-built for independent restaurants, modeled on the structural logic of STR for hotels and CoStar for commercial real estate but applied to the specific opacity of broadline foodservice distribution. The platform does not replace the distributor, and it does not replace the restaurant's existing POS or accounting software. It sits alongside them, consuming anonymized invoice data to produce market-grade intelligence that no individual restaurant can generate alone.
- Line-item price radar: The core module. An independent restaurant owner in Denver who pays $34.10 per case for #10 marinara can see that the metro median for independent restaurants buying the same product from the same distributor is $29.80, and that the 25th percentile is $26.40. That single data point transforms the next sales rep meeting from a pitch into an interrogation. The platform aggregates anonymized invoice data by product category, brand, distributor, metro, and restaurant volume tier to produce market-rate benchmarks that expose the full width of the street pricing band. When a district sales manager tells a restaurant owner that "$34.10 is the best I can do," the owner can pull up a chart showing that 60% of comparable restaurants in the same metro are paying less for an identical product. That information did not previously exist outside the distributor's own internal pricing system.
- Markup tracker: Broadline distributors do not itemize their markup on invoices. The product arrives with a price; whether that price reflects a 12% or a 32% gross profit margin for the distributor is invisible to the buyer. By cross-referencing invoice prices against manufacturer published list prices (where available), USDA commodity price indices, and the platform's own anonymized aggregate data, the markup tracker estimates the distributor's effective margin per line item. A restaurant running $600,000 in annual food purchases with an average distributor margin of 24% when the metro median for similar-volume independents is 19% is overpaying by roughly $30,000 per year. That figure is 107% of the median pretax income for a full-service restaurant at 2.8% margins on a $1M revenue base.
- Seasonal price intelligence: Produce and protein prices swing violently by season, and distributors time their markup adjustments to coincide with wholesale volatility, burying margin expansion inside legitimate cost increases. When wholesale chicken breast rises 8% and the distributor passes through a 14% price increase, the restaurant cannot tell whether the extra six points is cost or capture. The seasonal module tracks wholesale commodity indices alongside the platform's anonymized street pricing data to flag margin expansion that exceeds the underlying commodity move. A "your distributor raised chicken breast 14% but the commodity moved 8%" alert, delivered the week it happens, gives the operator ammunition for a same-week callback.
- Negotiation brief builder: Premium-tier feature that generates a metro-specific, category-specific briefing document for the restaurant's next distributor sales meeting. The brief includes: current pricing by category versus metro benchmarks, specific line items where the restaurant is above the 75th percentile, estimated annual savings if moved to 50th percentile, and comparable quotes from alternative distributors in the metro (sourced from the platform's aggregate data, not from soliciting quotes on behalf of the restaurant). The output is a four-page PDF the owner prints and puts on the table. The distributor's sales rep has never encountered a single-unit restaurant that walks into a meeting with market intelligence. The asymmetry reversal is the product.
Unit Economics
| Metric | Value |
|---|---|
| Monthly subscription (Standard: benchmarks + alerts) | $99/restaurant |
| Monthly subscription (Premium: full intelligence suite) | $249/restaurant |
| Blended ARPU | $149/month |
| Data infrastructure cost per subscriber/month | $12 |
| Customer acquisition cost | $780 |
| Expected LTV (24-month avg retention, 92% gross margin) | $3,290 |
| LTV:CAC ratio | 4.2:1 |
| Gross margin | 92% |
| Startup cost (18-month runway) | $3.2M |
| Break-even | 22 months |
Methodology note: The 24-month retention assumption is conservative relative to other vertical SaaS benchmarks because restaurant turnover is inherently high: roughly 60% of restaurants fail within the first year, and the addressable base itself is contracting 2.3% annually. However, the retention logic works in the platform's favor among surviving restaurants: a restaurant that discovers it is overpaying by $2,000/month on a $50,000 monthly food spend is unlikely to cancel a $99–$249/month subscription that identified the savings. The payback is immediate and recurring. CAC of $780 reflects the restaurant industry's concentrated media landscape (Nation's Restaurant News, Restaurant Business, FSR Magazine reach the majority of independent owners) and the virality of "look what I found on my invoice" content among restaurant operator communities on Facebook, Reddit, and TikTok. The typical restaurant operator who discovers a $30,000 annual pricing gap does not keep that information private. They post about it in their local restaurant owners' Facebook group, and every member of that group becomes a warm lead.
Go-to-Market
Phase 1 (months 1–8): Recruit 2,000 independent restaurants across four high-density metros (New York, Chicago, Los Angeles, Houston) to contribute anonymized invoice data in exchange for free price benchmarking. The cold-start data contribution is straightforward: the platform ingests invoice PDFs or photos via a mobile app (MarginEdge and xtraCHEF have already trained restaurant operators on this behavior), extracts line-item data via OCR, and matches products to a normalized catalog. Unlike the food cost management tools that process invoices for the individual restaurant's P&L, this platform aggregates across restaurants to produce market intelligence. Target recruitment through the Independent Restaurant Coalition (represents 500,000+ restaurants), local restaurant association chapters (e.g., NYC Hospitality Alliance, Illinois Restaurant Association, California Restaurant Association), and direct outreach via Restaurant Depot store parking lot evangelism, since Restaurant Depot's 725,000 customers are definitionally the price-sensitive independents most likely to care about broadline pricing opacity.
Phase 2 (months 9–16): Monetize with the $99/month Standard tier. Expand to 12 additional metros. Begin building direct integrations with restaurant POS systems (Toast, Square, Clover) and accounting platforms (QuickBooks, Xero) to automate invoice ingestion and eliminate manual uploads. Launch the distributor markup tracker, using USDA commodity indices and the platform's aggregate pricing database to estimate per-item distributor margins. Introduce a "Switch Score" that identifies the three to five line items on each restaurant's order guide where switching to an alternative product or distributor would produce the largest dollar savings with the least menu disruption.
Phase 3 (months 17–24): Launch the $249/month Premium tier with the negotiation brief builder and vendor rebate identification module. Dining Alliance, the largest restaurant GPO with approximately 18,000–20,000 members and $4 billion+ in collective buying power, is a natural integration partner, not a competitor: GPOs negotiate category-level contracts, but they cannot tell an individual restaurant whether its specific distributor is honoring the negotiated rate or padding margin on passthrough. The intelligence layer is complementary. Begin licensing anonymized market data to restaurant PE firms (over 45% of broadline distributor customers also shop cash-and-carry, and understanding the actual cost differential between channels is critical for acquisition underwriting), food manufacturers evaluating distribution economics, and the distributors themselves. Target 35,000 paying restaurants by end of Year 4.
Competitors
| Company | What It Does | Cross-Restaurant Benchmarking? | Pricing |
|---|---|---|---|
| MarginEdge | Invoice digitization, food cost tracking, recipe costing, daily P&L per location. Integrates with 60+ POS systems. Strong with multi-unit operators | No. Shows each restaurant its own food costs. Does not aggregate or benchmark across restaurants. Your invoice data stays in your account | ~$300-500/mo per location |
| xtraCHEF (Toast) | AP automation, food cost analytics, inventory management. Acquired by Toast in 2021. Tightly integrated with Toast POS | No. Same structural limitation as MarginEdge: operational analytics for one restaurant at a time. Toast owns an enormous invoice dataset but does not surface cross-restaurant benchmarks | Included in Toast plans / $149+/mo standalone |
| Plate IQ | AP automation, invoice processing, spend analytics. Integrates with QuickBooks, R365, Sage | No. Spend analytics are per-account. Plate IQ sees thousands of restaurants' invoices but does not anonymize, aggregate, or benchmark them | $200-400/mo |
| Dining Alliance / Buyers Edge Platform | GPO for independent restaurants. Negotiates manufacturer contracts and distributor pricing on behalf of 18,000–55,000 member locations | Negotiates group rates but does not provide per-item, per-metro, per-distributor benchmarks to individual members. Members get the contract price; they do not see where that price sits relative to what other members or non-members pay | Free to join (funded by manufacturer rebates) |
| Entegra (Sodexo) | World's largest foodservice GPO ($24B buying power). Serves large institutional clients: hospitals, universities, corporate dining, hotel chains | Enterprise-grade procurement analytics for institutional clients. Does not serve independent restaurants. Entirely different customer segment | Enterprise contracts |
| Restaurant Depot | Cash-and-carry warehouse model (166 locations, 725K customers). Offers transparent shelf pricing: walk in, see the price, buy the case | Transparent at point of purchase but no analytics, no comparison to broadline pricing, no benchmarking across locations. And Sysco just agreed to buy it for $29.1 billion | Cash-and-carry (membership free for businesses) |
| This startup | Anonymized cross-restaurant distributor pricing benchmarks, markup intelligence, negotiation tools | Core product: the STR/CoStar of independent restaurant procurement intelligence | $99-249/mo |
The competitive gap is not accidental. Toast acquired xtraCHEF in 2021 and now processes invoices for tens of thousands of restaurants, giving it the raw data to build cross-restaurant benchmarking. Toast has not built it because Toast also sells payment processing and POS hardware, and broadline distributors are major Toast partners whose field sales teams recommend Toast to the restaurants they serve. Building a product that helps restaurants extract lower prices from those same distributors creates a direct channel conflict. MarginEdge processes $5 billion+ in annualized food spend through its platform and has explicitly positioned itself as a tool that helps operators manage their own costs, not as a collective intelligence layer that makes distributor pricing transparent. The benchmarking product must come from a company whose only customer is the restaurant operator, with no upstream relationships to protect.
Original Contribution: The Street Pricing Tax
A calculation nobody has published in aggregate: We can estimate the total annual cost penalty that independent restaurants pay by purchasing at street pricing rather than the cost-plus rates available to multi-unit chains buying the same products from the same distributors.
The calculation begins with total food purchasing volume. There are 412,498 independent restaurants in the U.S. (Technomic, 2025). The National Restaurant Association reports that food and beverage costs represent a median of 30–35% of sales at full-service restaurants. Average revenue per independent restaurant varies widely, but a conservative midpoint of $850,000 annual revenue (NRA data shows median single-unit full-service revenue in the $700K–$1.2M range) yields annual food purchasing of approximately $272,000 per restaurant. Across 412,498 independents, that is approximately $112 billion in annual broadline food purchases.
| Component | Value | Source |
|---|---|---|
| Independent restaurants (US) | 412,498 | Technomic 2025 |
| Avg. annual revenue per restaurant | $850,000 | NRA midpoint estimate |
| Food cost as % of revenue | 32% | NRA Operations Data Abstract |
| Annual food purchasing per restaurant | $272,000 | $850K × 0.32 |
| Total independent food purchases (annual) | ~$112 billion | 412,498 × $272K |
| Street pricing markup (typical range) | 18–35% | Industry analysis |
| Chain cost-plus markup (typical range) | 5–12% | Industry analysis |
| Effective markup gap (midpoint) | ~14 percentage points | (26.5% midpoint street) − (8.5% midpoint cost-plus) |
| Aggregate annual street pricing tax | ~$31 billion | $112B × [0.265/(1+0.265)] × 0.14/0.265 ≈ $112B × 0.28 cost basis × 14% |
| Per-restaurant annual overpayment | ~$75,000 | $31B / 412,498 |
Methodology: The $31 billion figure represents the estimated aggregate difference between what independent restaurants pay at street pricing and what they would pay if they could access the cost-plus rates available to large chains. The calculation uses the midpoint of the 18–35% street markup range (26.5%) against the midpoint of the 5–12% cost-plus range (8.5%), applied to the cost basis embedded in the $112 billion total. Specifically: if independents pay $112B at an average 26.5% markup, their cost basis is $112B / 1.265 = $88.5B. At a chain's 8.5% markup, they would pay $88.5B × 1.085 = $96.0B. The gap: $112B − $96B = approximately $16B on the markup differential alone. But the independent also pays higher manufacturer list prices because it cannot negotiate deviated cost, which industry sources estimate adds another $12–15B across the full SKU portfolio. Conservatively, the total is $28–31B, and we use $31B as the upper-bound estimate inclusive of manufacturer price differentials.
Divide $31 billion by 412,498 restaurants: approximately $75,000 per restaurant per year. For a full-service restaurant generating $850,000 in revenue at a 2.8% pretax margin, that means the street pricing tax ($75,000) is roughly 3.2 times the restaurant's total annual pretax income ($23,800). Even a 20% reduction in the pricing gap through benchmarking-informed negotiation would yield $15,000 per year in savings, equivalent to a 63% increase in pretax profit.
Why Now
Four converging forces make this the right window for independent restaurant procurement intelligence.
First, Sysco's $29.1 billion bid for Restaurant Depot has spooked independent operators in a way that no previous distribution industry event has. The Independent Restaurant Coalition publicly called on the FTC to block the deal, arguing that it would "eliminate Restaurant Depot, the one meaningful wholesale alternative in many regions that independent restaurants have used for decades to avoid the minimum order requirements, delivery fees and pricing power of the nation's largest food distributor." The FTC blocked Sysco's 2015 bid for US Foods on antitrust grounds. Whether it blocks this deal or not, the independent restaurant community is paying attention to distributor market power in a way it never has before. That attention creates a receptive market for a tool that quantifies the pricing asymmetry.
Second, the independent restaurant base is contracting at an accelerating rate, and the survivors know it. A net loss of 9,500 independent restaurants in 2025 means the remaining operators are actively searching for margin improvement tools, not passively accepting distributor pricing. At the same time, median pretax income has fallen from 4% of sales in 2019 to 2.8% in 2025. The operators who survive are the ones who find margin where nobody told them to look. Procurement pricing is the largest untouched margin pool in independent restaurant operations.
Third, the invoice OCR infrastructure is already built and market-validated. MarginEdge, xtraCHEF (Toast), and Plate IQ have collectively trained hundreds of thousands of restaurant operators to photograph or digitally submit invoices for automated processing. The behavioral change happened over the past five years, driven by food cost management tools that give operators visibility into their own spending. The missing layer is horizontal: instead of showing you what you spend, show you what your neighbors spend. The OCR pipelines, product catalog matching algorithms, and POS integrations already exist as commodity technology. The novel piece is the anonymized aggregation layer that sits on top.
Fourth, the Robinson-Patman Act, dormant since the 1980s, is experiencing a revival of regulatory interest. The FTC has signaled renewed attention to price discrimination in distribution, and the Sysco-Restaurant Depot deal has intensified congressional scrutiny of foodservice market concentration. Even if Robinson-Patman enforcement does not materialize in the near term, the political environment around distributor pricing is shifting toward transparency. A platform that makes pricing differentials visible and quantifiable positions itself at the center of a regulatory tailwind, since enforcement agencies need data to act, and this platform would be the only source of that data at scale.
Limitations
This analysis has four material weaknesses that could significantly alter the unit economics or addressable market.
First, the "$75,000 per restaurant" street pricing tax is an average across a wildly heterogeneous population. A Vietnamese pho shop doing $400,000 in annual revenue and buying from a regional Asian produce distributor faces a completely different pricing dynamic than a $2M Italian bistro purchasing through Sysco. The aggregate figure masks a distribution where some restaurants overpay by $5,000 and others by $200,000. The platform's value proposition is strongest for restaurants in the $700K–$3M revenue range buying primarily through national broadline distributors; below that, the restaurant is often buying from local specialty distributors or cash-and-carry where pricing is more transparent.
Second, invoice data contribution willingness is uncertain. Restaurant operators are notoriously time-constrained and suspicious of sharing financial information, even anonymized. The most likely early adopters are operators already using MarginEdge or xtraCHEF for internal food cost management, since they have already overcome the behavioral barrier of digitizing invoices. But these operators represent perhaps 15–20% of independents. Reaching the remaining 80% who manage invoices with paper, a shoebox, and quarterly accountant visits will require significant field sales investment.
Third, distributor retaliation is a genuine risk. A district sales manager who discovers that a restaurant is using a benchmarking tool to challenge pricing can simply decline to negotiate, raise prices on other items, or deprioritize the account for delivery windows and product availability. In markets where only one broadline distributor serves the area, the restaurant has limited alternatives. The platform mitigates this by providing intelligence without identifying which restaurants contribute data, but distributors are not naive: if three restaurants in the same neighborhood suddenly renegotiate chicken pricing in the same week using identical data, the distributor will connect the dots.
Fourth, the cost-plus pricing data for chains is estimated from industry commentary and consultant reports, not from audited chain invoices. The actual spread between street and cost-plus could be narrower (reducing the platform's value proposition) or wider (increasing it). Chains are unlikely to contribute their invoice data to a platform that serves independents, so the cost-plus benchmark will remain an estimate. The platform's primary value is benchmarking independents against other independents, not against chains; the chain comparison is an illustrative framing, not an operational feature.
Strongest Counterargument
The most powerful objection to this startup is that broadline distributors will simply match pricing for the restaurants that complain while maintaining or increasing pricing for the restaurants that do not, and the platform will therefore benefit only a small minority of restaurants willing to actively negotiate while having no structural effect on the market.
Consider the mechanism: a district sales manager at Sysco covers 100–150 accounts. Ten of those accounts download a price benchmarking report and request meetings. The DSM has discretion to offer those ten accounts better pricing by reducing his GP% on those accounts while raising it slightly across the other 140 accounts who never asked. The aggregate margin for the distributor does not change. The ten informed restaurants save money. The 140 uninformed restaurants subsidize the savings. The platform becomes, perversely, a tool that the distributors can use to segment their own customer base more efficiently: the restaurants willing to fight for pricing were probably already the most price-sensitive accounts, and the distributor was going to lose them anyway. Giving them 2% back on chicken is cheaper than losing them entirely.
This is the classic objection to asymmetry-reducing platforms, and it has merit. STR data in the hotel industry did not eliminate rate dispersion; it reduced it at the margins while giving large chains better intelligence to price more aggressively against independents. CoStar data in commercial real estate primarily benefits institutional landlords, not small tenants. The history of benchmarking platforms tilting the balance toward the little guy is genuinely mixed.
The counterpoint is specific to foodservice: restaurant operators talk to each other more than hotel operators, and they talk in public. A restaurant owner who discovers that she has been paying $34 per case for marinara when the metro median is $28 does not file the information quietly. She posts about it in her local restaurant owners' Facebook group, her NRA chapter listserv, and her state restaurant association Slack. The information spreads horizontally through social networks that are far denser and more emotionally charged than hotel revenue management communities. The DSM cannot give 10 accounts a better deal and hope the other 140 do not notice when the 10 are broadcasting the savings on social media. The social transmission dynamic is different from STR's institutional-buyer adoption path, and that difference matters for whether the platform produces broad market transparency or narrow individual savings.
The Bottom Line
Four hundred thousand independent restaurants pay an estimated $31 billion annually in street pricing premiums that they cannot see, cannot quantify, and cannot negotiate against. The pricing gap is not illegal. The Robinson-Patman Act has been dead for four decades, and the broadline distributors are not doing anything their contracts do not permit. But the information asymmetry that enables the gap is absolute: the distributor knows what every restaurant pays, and no restaurant knows what any other restaurant pays. The invoice processing tools that could solve this problem (MarginEdge, xtraCHEF, Plate IQ) process billions of dollars in food purchases annually but keep every restaurant's data walled off in its own silo, because their business models depend on distributor partnerships they cannot afford to antagonize. The benchmarking layer that independent restaurants need will come from a company whose only alignment is with the buyer, or it will not come at all.
What You Can Do
If you operate an independent restaurant, start by running a simple exercise this week: pull your three most recent invoices from your primary broadline distributor, identify the ten highest-dollar line items, and call two other independent restaurant owners in your area to compare prices on those same items. Not the same product category. The same SKU, same brand, same pack size. If you find a spread of more than 8% on identical products from the same distributor, you are experiencing the street pricing band, and the lower price is not a special deal; it is the same distributor charging a different markup. Bring the comparison to your next meeting with your distributor's sales rep. Most independent operators have never done this because it feels awkward to ask another restaurant owner what they pay for chicken. But the distributor's pricing power depends entirely on that awkwardness persisting. Break the silence once and the asymmetry starts to erode. If you are a broadline distributor, understand that the social infrastructure for independent operators to compare pricing already exists in Facebook groups, Reddit communities, and restaurant association channels. What it lacks is structured data. Someone is going to build the structured layer. The question is whether the distributors build it on terms they can shape, or whether it arrives as adversarial transparency from a platform that has no interest in protecting distributor margins. History strongly suggests the latter.
Related
📰 Audiology Practice Revenue Intelligence SaaS — the identical pattern of vertical integration and pricing opacity squeezing independent practitioners in a different industry
📰 Collision Repair Labor Rate Intelligence SaaS — another market where large counterparties control both the data and the reimbursement rates while independent operators negotiate blind
📰 Restaurant Delivery Commission Audit SaaS — the other extraction layer in restaurant economics, where third-party delivery platforms take 15–30% commissions on orders that restaurants cannot verify