America's Power Transformers Are 38 Years Old. Replacements Take 5 Years. The Diagnostics Run on Spreadsheets.
Seventy percent of large power transformers in the U.S. have passed the quarter-century mark. Replacement orders sit in a queue that stretches three to five years. And 2,900 public power utilities and rural electric cooperatives manage diagnostic oil tests in Excel spreadsheets and filing cabinets while data centers prepare to consume a fifth of the nation's electricity.
The Problem
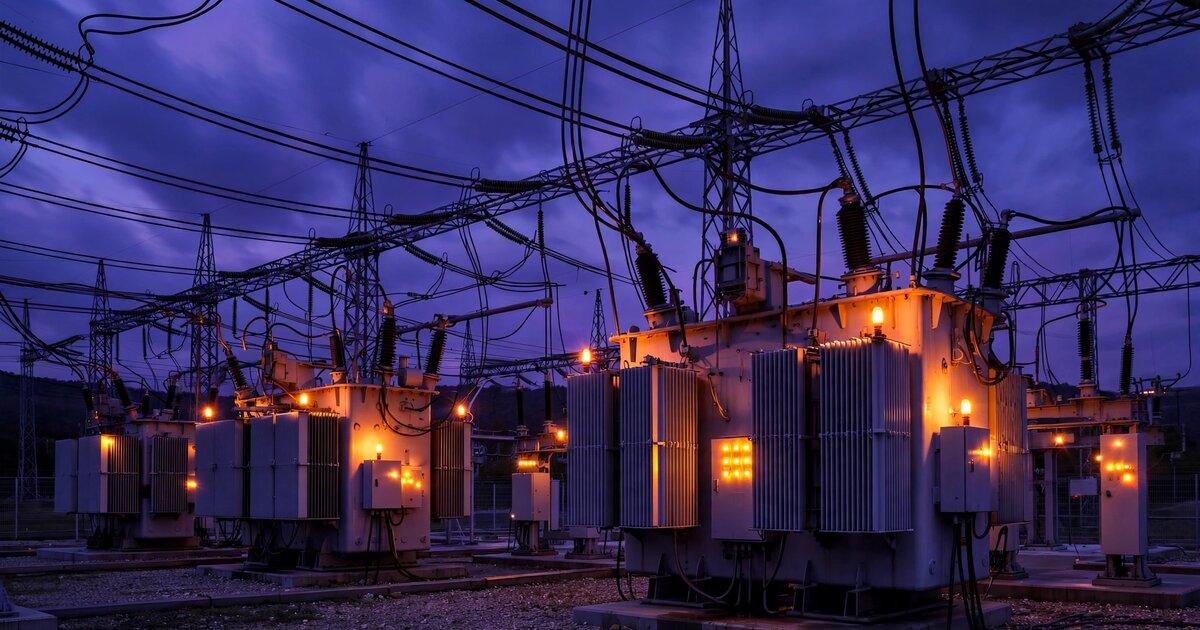
Roughly 25,000 to 30,000 large power transformers sit in America's transmission grid, according to IndexBox's 2026 market analysis. These are not the green canisters on telephone poles. They are building-sized machines that weigh 100 to 400 tons, cost $3 million to $10 million apiece, and step voltage from 345 kV down to the distribution level that feeds neighborhoods and factories. A Department of Energy study found that the average age of installed LPTs is 38 to 40 years, with 70 percent being 25 years or older. Designed for a 40-year service life. America is running on borrowed time.
Replacements cannot keep up. Reuters reported in July 2026 that lead times for high-voltage transformers have stretched to multiple years, up from roughly one year in 2020 and 2021. AI data center demand is the accelerant: BloombergNEF projects that data centers will consume 20 percent of U.S. electricity by 2035 (enough to power roughly 26 million homes), up from 5.9 percent today. Every new gigawatt of data center capacity requires substation transformers that compete for the same constrained manufacturing slots as the replacement units that aging utilities desperately need.
So utilities face a triage problem. An operator that owns 15 or 50 or 200 transformers of varying age, condition, and criticality has to decide which units to monitor intensively, which to schedule for proactive replacement, and which to run until failure. When one of these 200-ton assets fails without warning, the utility scrambles to rent a mobile substation at $40,000 a month while 15,000 customers wonder why the lights flicker every afternoon. Dissolved gas analysis, the practice of sampling the oil that bathes the transformer's windings for telltale gases produced by insulation degradation and arcing, has been the diagnostic gold standard since the 1970s. A single DGA lab test costs $75 to $200. An online DGA monitor that samples continuously runs $15,000 to $60,000 per unit. IEEE and IEC have published standardized diagnostic ratios that any electrical engineer can apply.
But for the public power segment, the intelligence layer between raw DGA data and the capital planning decision barely exists. A transformer engineer at a municipal utility in Kansas or a cooperative in rural Georgia receives a PDF from a contract lab four times a year, opens Excel, types in the gas concentrations, and squints at a trend line. No automated anomaly detection across the fleet. No benchmarking against industry peers. No remaining-useful-life model that integrates loading history, ambient temperature, and DGA trajectory into a probability-weighted failure forecast. Duke, AEP, and Southern Company have built or bought asset health management platforms. Everybody else is flying blind on the most expensive, least replaceable equipment they own.
Market Size
Addressable segment: APPA represents more than 2,000 community-owned utilities serving 54 million people. NRECA represents nearly 900 cooperatives (832 distribution, 64 G&T) serving 42 million people across 56 percent of the nation's landmass. Together, these 2,900+ entities account for roughly 26 percent of U.S. electricity sales. Based on their proportional share of the national fleet and DOE capacity data, they collectively own and operate an estimated 6,000 to 9,000 large power transformers at the substation and transmission level, plus hundreds of thousands of distribution transformers.
Not all of them can justify the subscription. Many APPA members serve fewer than 1,000 customers and own one or two substation transformers. Utilities with 10 or more substation-class units represent the realistic target: approximately 800 public power utilities and 300 cooperatives (the 64 G&T cooperatives plus the larger distribution co-ops). Call it 1,100 entities at the broad end, or 600-800 if penetration assumptions are conservative; the Limitations section below explains why the lower number is probably more honest.
At $1,200/month for a Standard tier and $2,800/month for a Premium tier, with a projected 60/40 split, the blended ARPU is $1,840/month. At the conservative base of 700 addressable utilities, the SaaS TAM is $15.5 million in annual recurring revenue. Add a transactional layer for DGA lab test brokering, connecting utilities with certified labs and managing chain of custody, taking a $25 fee per test. At an estimated 4 tests per transformer per year across roughly 7,500 transformers in the addressable segment (a conservative estimate from the fleet proportions above), that is 30,000 tests generating $750,000 annually. Even at the broader 1,100-entity estimate, total TAM reaches $24.3 million plus $1.1 million in test brokering. This is a focused vertical SaaS play, not a unicorn hunt, similar in scale to successful infrastructure analytics companies like Aquicore (building energy, acquired by JLL) and Enertiv (same space, sold to Measurabl).
The Product
A cloud-based transformer fleet health intelligence platform that ingests DGA results from any source (lab reports, online monitors, SCADA historians), normalizes the data, and produces fleet-wide risk rankings, failure predictions, and capital planning recommendations. Four core modules:
- DGA Data Hub: Automated ingestion of lab reports (PDF parsing, CSV import, API integration with major contract labs like SDMyers, Weidmann, and Doble), plus direct integration with online DGA monitors from Serveron/Qualitrol, ABB, GE Vernova, and Dynamic Ratings. Normalizes gas concentrations, flags data quality issues (contaminated samples, measurement inconsistencies across labs), and maintains a complete historical DGA record per transformer. Eliminates the spreadsheet. Sounds simple, but for a utility that has used three different labs over 20 years and has gas values recorded in five different units across eight different file formats, this is a real problem that nobody has solved for them in a way that requires zero IT staff.
- Automated Diagnostic Engine: Applies IEEE C57.104-2019 gas interpretation guidelines, Duval Triangle (including Triangles 4 and 5 for stray gassing and low-energy faults), Rogers Ratios, and Key Gas Method automatically to every new data point. Color-coded fleet dashboard surfaces transformers requiring immediate attention. Rate-of-change alerting catches accelerating degradation before the next scheduled lab test. Cross-correlates DGA trends with loading data (where SCADA integration exists) and ambient temperature to distinguish thermal overloading from internal faults. The diagnostics here are not novel. What is novel is applying them systematically across a fleet when most small utilities do it manually, inconsistently, and often months after the lab report arrives.
- Remaining Useful Life (RUL) Estimator: Machine learning model trained on anonymized DGA histories, failure records, and asset metadata contributed by participating utilities (with data contribution incentivized through reduced subscription pricing). Outputs a probability distribution of remaining life for each transformer, updated with every new DGA result. The training data is the moat: every utility that contributes historical DGA and failure data makes the model more accurate for all participants, creating a network effect that a hardware vendor's proprietary model, trained only on its own monitors' data, cannot replicate. Initial model trained on published failure datasets (IEEE reliability studies, CIGRE TB 761) and augmented as customer data accumulates.
- Capital Planning Optimizer: Takes the RUL estimates, current replacement costs (including lead time-adjusted procurement costs that account for the 3-5 year order queue), criticality rankings (based on load served, available redundancy, and N-1 contingency analysis), and budget constraints, and produces a 10-year transformer replacement schedule that minimizes total cost of ownership. Answers the question that keeps utility planners awake: "I have $4 million this year and 12 transformers older than 35 years. Which three should I replace, which five should I monitor online, and which four can wait?" This module is where the subscription pays for itself. A single deferred replacement that allows a critical transformer to run two additional years (instead of replacing it prematurely at $5 million) saves the subscription cost for a decade.
Unit Economics
| Metric | Value |
|---|---|
| Monthly subscription (Standard: DGA management + automated diagnostics) | $1,200/utility |
| Monthly subscription (Premium: RUL modeling + capital planning) | $2,800/utility |
| Blended ARPU (60/40 Standard/Premium) | $1,840/month |
| Infrastructure cost per subscriber/month (cloud, ML compute) | $85 |
| Lab integration & data ops cost per subscriber/month | $45 |
| Customer acquisition cost | $8,500 |
| Expected LTV (36-month avg retention, 93% gross margin) | $61,516 |
| LTV:CAC ratio | 7.2:1 |
| Gross margin | 93% |
| Startup cost (18-month runway) | $3.4M |
| Break-even | 22 months |
Methodology note: The 36-month average retention assumption reflects the embedded workflow dynamic: once a utility's DGA records, diagnostic history, and capital plan live in the platform, switching costs are high and the annual subscription ($14,400-$33,600) is trivial relative to the asset values under management ($50 million to $500 million in transformer fleet replacement value for the target segment). CAC of $8,500 reflects the conference-heavy, relationship-driven sales cycle in public power (APPA's National Conference, NRECA's PowerXchange, regional conferences) combined with pilot-to-paid conversion. Gross margin of 93% reflects SaaS economics where the primary variable cost is cloud infrastructure, lab API integrations, and a small data operations team for ingestion normalization. LTV: $1,840 × 36 × 0.93 = $61,516. Payback: 4.6 months after activation.
Go-to-Market
Phase 1 (months 1-9): Recruit 30 pilot utilities from three high-density public power regions: the Nebraska public power district system (the entire state is served by public power, with over 160 entities), the Pacific Northwest (BPA preference customers, including dozens of municipal utilities and PUDs), and the Southeast cooperative belt (large G&T cooperatives like Oglethorpe Power, PowerSouth, and Associated Electric). Offer a free 12-month Standard tier in exchange for contributing historical DGA data (minimum 5 years) to seed the RUL model's training dataset. Target utilities that have experienced at least one unplanned transformer failure in the last decade, because they have both the pain and the data. Distribution through APPA's Demonstration of Energy & Efficiency Developments (DEED) program, which funds technology pilots for public power, and NRECA's Cooperative Research Network (CRN), which provides matching funds for member co-ops evaluating new technology.
Phase 2 (months 10-18): Monetize the Standard tier at $1,200/month. Launch the Premium tier with the RUL estimator trained on Phase 1 data. Expand through state and regional associations: the Minnesota Municipal Utilities Association (132 members), the Texas Public Power Association (72 members), the Florida Municipal Electric Association (33 members). These associations hold annual engineering conferences where a single presentation to 50 utility planners can generate 10-15 qualified leads. Integrate with the three largest contract DGA labs (SDMyers, Doble, Weidmann) so that lab reports flow directly into the platform without manual upload, eliminating the highest-friction step in adoption.
Phase 3 (months 19-30): Launch the Capital Planning Optimizer as a Premium add-on. Open the anonymized benchmarking module that lets utilities compare their fleet age, DGA profiles, and replacement rates against regional and national cohorts. Approach the 64 G&T cooperatives as enterprise accounts: a G&T that supplies power to 15-30 distribution co-ops can drive adoption across its member base. Enterprise pricing at $5,000/month covers the G&T's own fleet plus a benchmarking overlay for member distribution transformers. Begin international expansion with Canadian public power systems (Hydro One, BC Hydro, SaskPower), which face identical aging fleet dynamics with even longer procurement lead times due to customs and Buy-Canada provisions.
Competitive Landscape
| Company | What It Does | Fleet Analytics? | Public Power Focus? |
|---|---|---|---|
| Qualitrol/Serveron | Online DGA monitors (TM1, TM3, TM8) with TM View visualization software | Basic: trending for monitors they sell, not fleet-wide | No: sells to all utility types, no segment-specific product |
| ABB / Hitachi Energy | Online DGA monitors (CoreSense) plus Lumada APM for asset management | Yes, but enterprise-scale: Lumada APM is a $500K+ deployment for large IOUs | No: priced and scoped for utilities with $50M+ IT budgets |
| GE Vernova | Kelman DGA monitors plus APM Health analytics platform | Yes, same issue: enterprise pricing, requires GE ecosystem buy-in | No: minimum viable deployment is $200K+ with professional services |
| Dynamic Ratings | Online transformer monitoring (DGA, load, temperature) with analytics | Moderate: better analytics than Qualitrol, still hardware-centric | Some: smaller deployments, but analytics tied to their monitors only |
| Doble Engineering | Field test equipment, contract lab services, dobleARMS software | Historical: dobleARMS was pioneering but aging, desktop-based, not cloud-native | Partial: strong APPA presence, but dobleARMS hasn't been modernized |
| SDMyers | Contract DGA lab, oil analysis, consulting | Lab reports with recommendations, no persistent analytics platform | Yes, but service model, not SaaS: every analysis is a new billable engagement |
| This startup | Monitor-agnostic fleet health intelligence, lab-to-capital-plan SaaS | Core product: ingests all sources, fleet-wide RUL and capital planning | Yes: purpose-built for 2,900+ public utilities and cooperatives |
The structural gap mirrors what happened in healthcare diagnostics. Large hospital systems (the IOUs of healthcare) have Epic and Cerner platforms that aggregate lab results, apply clinical decision support rules, and produce population health analytics. Small clinics and rural hospitals (the munis and co-ops of healthcare) used to manage lab results in paper charts and standalone PDFs until cloud-native platforms like athenahealth built purpose-built EHRs that aggregated the same data at a price point and complexity level appropriate for 5-physician practices. The transformer health market has its Epics (ABB Lumada, GE APM Health). It does not have its athenahealth. Every existing competitor either sells hardware and treats analytics as an afterthought, or sells enterprise analytics platforms that require six-figure implementations and dedicated IT teams that a 50-person municipal utility does not have.
Why Now
Start with the shortage. The U.S. utility-scale high-voltage transformer market grew from $3.8 to $4.2 billion in 2026 and is forecast to reach $7.5 to $9.0 billion by 2035 (IndexBox). Annual replacement procurement is rising from 800-1,000 units in 2026 to a projected 1,400-1,800 units by 2035 as the aging fleet hits the replacement cliff at the same time data centers and renewable interconnection pile into the manufacturing queue. When you cannot get a replacement transformer for three to five years at any price, extending the life of your existing fleet by two or three years through early fault detection stops being a nice-to-have. It becomes the only option.
Data center power demand amplifies the problem beyond anything the grid planned for. BNEF forecasts 194 gigawatts of data center demand by 2035 (enough to power roughly 65 million homes), an 83 percent increase over BNEF's own December forecast. Small utilities across the Midwest and Southeast are fielding inquiries from data center developers who want 50 MW to 200 MW connections. A cooperative in rural Ohio that has operated 150 MW of peak load for 30 years is suddenly being asked to double its capacity. Every expansion path runs through existing substation transformers that may or may not survive the increased loading. Knowing which ones can handle the stress is the gatekeeping question for data center interconnection, and the answer lives in DGA data that nobody is systematically analyzing.
Meanwhile, the diagnostic standard itself just changed. IEEE C57.104-2019 significantly updated gas concentration thresholds and diagnostic ratios for the first time since 2008. Utilities that previously considered a transformer "healthy" under the old thresholds may need to reclassify it under the new standard. Re-evaluating an entire fleet against updated criteria manually in spreadsheets for 40 or 100 transformers takes months. A platform that applies the new standard automatically and flags every unit whose status changed sells itself to the utility's standards compliance officer.
Federal funding lowers the acquisition barrier. The Bipartisan Infrastructure Law allocated $2.5 billion for grid resilience and innovation grants through DOE's GRIP program. NRECA's Cooperative Research Network provides matching funds for member co-ops evaluating new technology. APPA's DEED program funds technology pilots for public power utilities. These programs can cover 50 to 80 percent of first-year subscription costs, giving the startup a subsidized go-to-market channel that private-sector SaaS companies rarely enjoy.
Original Contribution: The Replacement-Queue-Adjusted Risk Premium
A calculation we have not seen published elsewhere: Traditional transformer risk assessment uses a single metric: the probability of failure within a given time horizon, derived from DGA trend analysis and age. But probability of failure alone does not capture the economic consequence in a market with multi-year replacement lead times. A transformer with a 15 percent probability of failure in the next 24 months is a manageable risk when a replacement can be delivered in 12 months. That same 15 percent probability becomes existential when the replacement queue is 42 months, because the expected exposure window (the time between failure and replacement delivery) stretches from zero to 18 months of operating without the asset.
We define the Replacement-Queue-Adjusted Risk Premium (RQARP) as the expected unserved-energy cost created by the gap between probable failure timing and replacement delivery timing. For a 60 MVA transformer serving a 45 MW peak load with no installed spare or mobile substation capability, an 18-month exposure window at a wholesale scarcity price of $1,000/MWh (the price utilities actually pay during peak shortfall events, roughly 10 times the retail rate and consistent with recent MISO and PJM scarcity pricing) produces an expected cost of:
| Factor | Value |
|---|---|
| Failure probability (24-month horizon) | 15% |
| Exposure window (failure to replacement delivery) | 18 months |
| Peak load served | 45 MW |
| Peak hours per month | 200 |
| Wholesale scarcity price | $1,000/MWh |
| Expected risk-adjusted cost | $24.3 million |
| Annual Premium subscription cost | $33,600 |
| Risk-reduction ratio | 723:1 |
That 723:1 number is an actuarial abstraction, not a realized savings figure: it compares a certain annual cost (the subscription) against a probability-weighted expected cost (the modeled outage scenario). Using MISO's full Value of Lost Load at $10,000/MWh would produce a figure ten times larger, which illustrates why reliability planners consider transformer failure a catastrophic risk even at moderate probabilities. Even adjusting for the reality that most utilities have contingency capability (load transfer, mobile substations, curtailment) sufficient to cover 70 percent of load, the residual exposure drops to $7.3 million, still a 217:1 ratio. What matters is not the precise figure but the directional insight: the economic justification for fleet-level DGA analytics has fundamentally changed in a world where replacement lead times have tripled. The risk premium scales with the queue length, and the queue has never been longer.
Limitations
This analysis has blind spots that need stating plainly.
The "2,900+ public utilities and cooperatives" figure overstates the addressable market. Many APPA members serve fewer than 1,000 customers, own one or two substation transformers, and operate on a total annual budget under $5 million. For them, a $14,400/year SaaS subscription is a real budget line, and "transformer monitoring" means a single engineer who inspects the unit quarterly and sends an oil sample once a year. The Market Size section already adjusts to a realistic range of 600-800 utilities, but it is worth repeating: the broad number is misleading.
The RUL model's accuracy depends entirely on training data quality and breadth. Published failure datasets from IEEE and CIGRE are small, often fewer than 200 documented failures, and heavily biased toward European and Japanese utilities whose operating conditions, loading patterns, and maintenance practices differ from American public power. Building a proprietary dataset requires utilities willing to share sensitive asset data, including failure records they may consider embarrassing or legally sensitive, particularly if a failure caused a fire, environmental contamination, or customer injury. This is also a data governance question: aggregated fleet health data for thousands of power transformers is a security-relevant dataset, and the platform would need NERC CIP-adjacent security posture and clear data ownership terms that small utilities can evaluate without in-house counsel.
DGA itself has known diagnostic blind spots. Dissolved gas analysis detects faults that produce gas: thermal degradation, arcing, partial discharge, cellulose decomposition. It does not detect all failure modes. Bushing failures account for roughly 16 percent of transformer forced outages (per a CIGRE survey), and tap changer malfunctions and external short-circuit damage leave minimal DGA signatures. A utility that relies exclusively on DGA analytics for failure prediction will miss roughly one in five transformer failures, and the ones it misses tend to be sudden and catastrophic rather than gradual.
The competitive moat may be thinner than it appears. Doble Engineering has 70 years of relationships with every utility in the APPA and NRECA membership base, a contract lab that processes hundreds of thousands of DGA samples annually, and the dobleARMS software platform that, while aging, already holds historical DGA data for thousands of transformers. If Doble decided to modernize dobleARMS into a cloud-native platform with ML analytics, they could replicate this entire product with a 12-month development effort and an existing customer base. The bet is that Doble, as a Danaher subsidiary focused on high-margin test equipment, will not prioritize a low-ARPU SaaS product for small utilities. That bet could be wrong.
Strongest Counterargument
The most compelling case against this startup is that the utilities it targets may be rationally choosing spreadsheets, and that their choice reflects a cost-benefit analysis that sophisticated analytics cannot improve.
Consider the economics from the perspective of a 50,000-customer cooperative in rural Alabama that owns 28 substation transformers averaging 32 years old. The co-op sends oil samples to a contract lab four times a year at $150 per sample. Total annual DGA cost: $16,800. The lab report includes a one-page interpretation with color-coded status (Normal, Caution, Warning, Critical) and a brief narrative. The co-op's single transformer engineer reads these reports, knows every unit by history and idiosyncrasy (Unit 7 has always run hot because it's next to the asphalt parking lot; Unit 14's hydrogen reads high because the nitrogen blanket has a slow leak), and makes informed decisions that a statistical model, lacking that contextual knowledge, would get wrong.
The co-op's actual risk exposure from transformer failure is also lower than the RQARP model suggests. Most cooperatives belong to a G&T cooperative or a statewide mutual aid network that maintains a shared inventory of mobile substations and portable transformers. When Oglethorpe Power's member co-op in south Georgia lost a 25 MVA transformer in 2024, a mobile unit was deployed from the shared pool within 72 hours and served load at reduced capacity for 14 months while the replacement was manufactured. The cost was real (roughly $600,000 in rental and transportation), but not the $7-24 million catastrophe that the unserved-energy calculation implies.
The counterargument, stated plainly: for many small utilities, the combination of experienced engineers with institutional knowledge, quarterly lab reports, and mutual aid networks already provides a level of risk management that is adequate for their scale. Adding a $14,400/year analytics platform might produce marginally better failure predictions, but the marginal improvement may not justify the cost for an organization whose entire IT budget is $200,000 and whose board of directors evaluates technology purchases against rate impact on residential customers paying $0.11/kWh. The market for sophisticated analytics exists, but it may be at the G&T cooperative and large municipal utility level (the top 200-300 entities), not the broad public power base of 2,900.
The Bottom Line
America's power grid runs on transformers that are, on average, two years past their design life. The replacement queue has never been longer. Data centers are about to double the load on equipment that was installed when Jimmy Carter was president. Dissolved gas analysis has been the diagnostic gold standard for five decades, and yet the analytical layer that turns periodic oil tests into fleet-wide failure predictions and capital planning intelligence is available only to the largest investor-owned utilities. Twenty-nine hundred public power utilities and cooperatives, collectively responsible for keeping the lights on for 96 million Americans, manage this data in spreadsheets. The cold-start data problem is real, Doble could wake up and compete, and many small utilities may rationally prefer their current approach. But with transformer lead times at 3-5 years and replacement costs at $3-10 million, the cost of a missed DGA signal has never been higher, and the analytical tools to catch it have never been cheaper to build.
What You Can Do
If you work at a public power utility or cooperative that owns substation transformers: pull your DGA records for the last ten years and calculate the gas generation rate (ppm per year) for hydrogen, methane, and ethylene for each unit. Any transformer showing an accelerating rate of change (the last two years' generation rate exceeding the prior eight-year average by more than 50 percent) deserves immediate follow-up regardless of whether absolute concentrations have triggered the IEEE C57.104-2019 Condition 3 or 4 thresholds. Rate of change catches faults earlier than absolute thresholds. Then check whether your lab reports are using the 2019 or the older 2008 edition of C57.104; the thresholds changed significantly, and a transformer that was "Normal" under the 2008 standard may be "Caution" under 2019. If you are at a G&T cooperative that serves 15-30 distribution members: aggregate your members' DGA data into a single view. You likely have 200-400 substation transformers across the membership, enough to identify regional patterns (are transformers in your southern territory aging faster than northern ones, possibly due to higher ambient temperatures?) and enough to negotiate volume pricing with contract labs. If you build enterprise software and are looking for a vertical SaaS opportunity with federal funding tailwinds: this market is wide open. Start by attending APPA's Engineering & Operations Technical Conference and talking to 20 utility engineers about how they manage DGA data. You will hear "Excel" more often than any other word.
Related
📰 EV Charger Uptime Compliance SaaS — another grid infrastructure monitoring play driven by regulatory mandates and equipment reliability gaps
📰 Building Energy Compliance SaaS — compliance-driven analytics for a fragmented operator base facing tightening federal and state requirements
📰 Commercial Roof Lifecycle Intelligence — the STR benchmarking model applied to another aging-asset class where replacement timing drives cost